NEXT asked 2,000 US adults how lucky they feel, which lucky breaks they’ve actually had, and what they do to tip the odds. Here’s what America’s relationship with luck looks like heading into 2027.
Key Findings
83%
of Americans had at least one lucky break in the past five years, but only
31%
rate their own luck 7 or higher out of 10.
1 in 3
Americans with four or more lucky breaks still rate their luck 5 or lower.
69%
believe some people are simply born lucky.
28%
still won’t walk under a ladder, and
48%
of Gen Z think superstitions actually work.
1 in 7
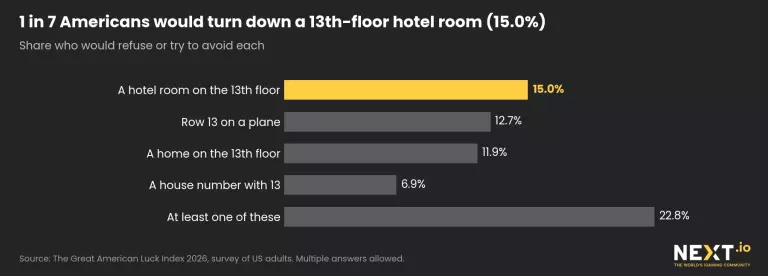
would turn down a 13th-floor hotel room.
Half
of sports fans have a game-day ritual.
75%
have a lucky number, and 7 wins by a landslide.
1 in 4
Southerners eat black-eyed peas for luck on New Year’s.
Sagittarians
rate their own luck highest;
Scorpios
rate theirs lowest.
Luck shows up more often than we give it credit for. You find something you thought was gone for good. You land the job you wouldn’t have bet a dollar on. You change plans at the last minute and dodge a bad day. Then someone asks you to rate your luck, and you shrug: “Eh, a 5.”
That’s the paradox at the heart of the Great American Luck Index 2026. Americans give their own luck an average score of
5.3 out of 10, yet
83%
have had at least
one
of the eight lucky breaks we asked about in the past five years, and
62%
have had
two or more. Three in four (76%) follow at least one superstition, half have a lucky charm or ritual, and
75%
have a lucky number. The luck is out there. Most people just don’t count it.
If luck had a customer service line, it would be swamped with “never received” complaints.
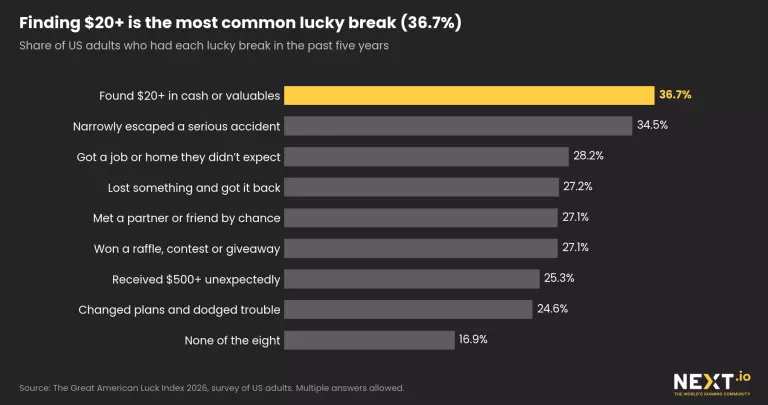
The most common lucky break is also the most down-to-earth:
37%
found cash or something worth at least
$20. Another
35%
narrowly escaped a serious accident, and
28%
landed a job or a home they’d given up on. Even a winning streak doesn’t change how people see themselves. Among Americans who had four or more of the eight lucky breaks,
1 in 3
(32%) still rate their luck 5 or lower.
“More than 8 in 10 Americans have had a lucky break in the past five years. Fewer than 1 in 3 call themselves lucky.”
Bad Luck Happens, Too
Luck runs both ways. Nearly
8 in 10
Americans (79%) had at least
one unlucky break in the past fiveyears, and about 1 in 4 (26%) had
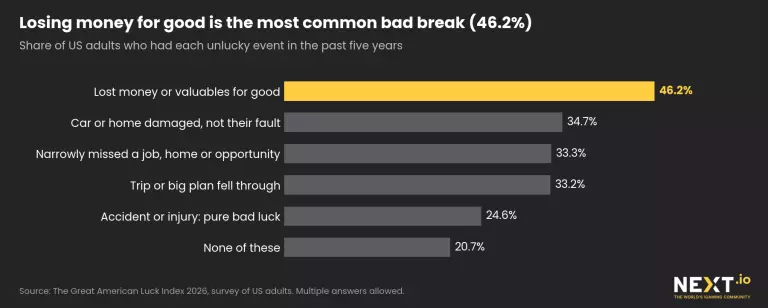
three or more. The most common is also the most frustrating:
46%lost money
or something valuable and never got it back. More than
1 in 3
had their
car or home damaged
through no fault of their own.
Gen Z, the Meet-Cute Generation
Nearly
half of Gen Z
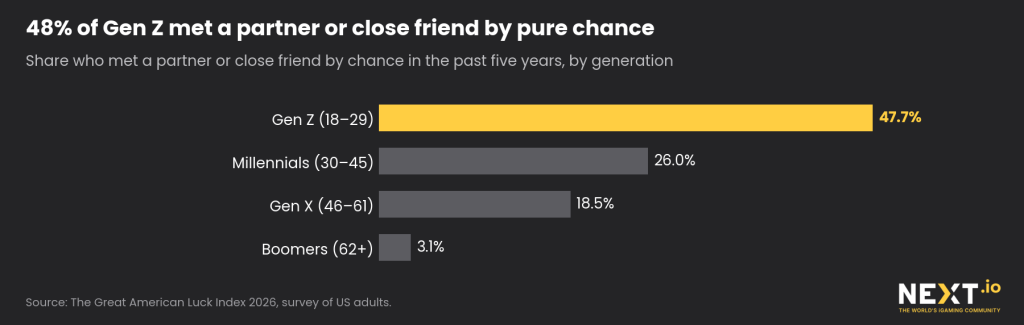
has a story that starts with “If I hadn’t gone out that night…”:
48%
met a partner or close friend by pure chance in the past five years, compared with
26%
of Millennials and
18%
of Gen X.
Chance cuts both ways for younger Americans. Four in 10 Gen Zers (40%) had a
trip or big plan fall through,
vs. 22% of Gen X. And men are more likely than women to report an accident or injury they chalk up to pure bad luck (30% vs. 21%).
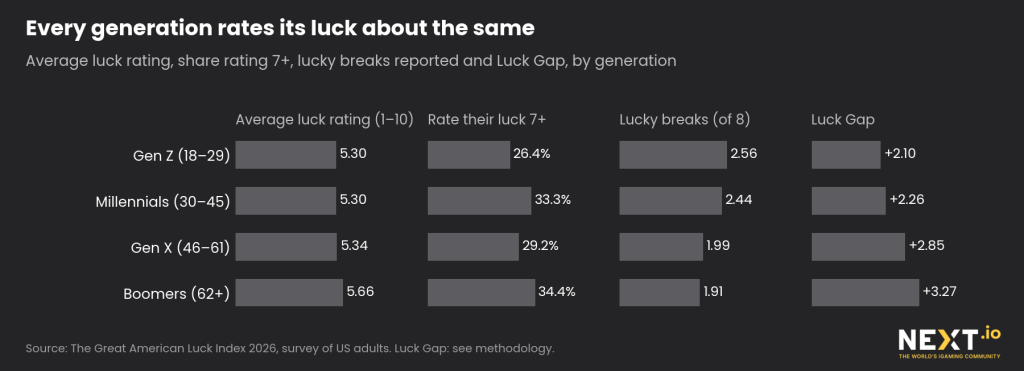
Luck ratings barely move with age, from 5.3 to 5.7 out of 10, but the number of lucky breaks people report falls. Younger adults may simply remember recent breaks more clearly, and milestones like a new job, a new home or a new relationship tend to come early in adult life. The result:
the Luck Gap, which compares a
group’s luck rating with the lucky breaks it reports, grows with age, from +2.1 for Gen Z to +2.9 for Gen X (+3.3 among Boomers).
“48% of Gen Z met a partner or close friend by pure chance. Among Gen X, it’s 18%.”
Self-Made Until Proven Otherwise
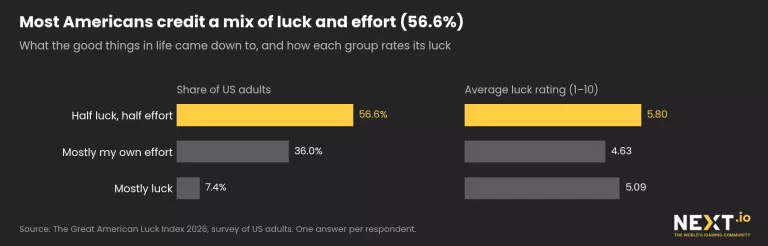
Most Americans (57%) say the good things in their life came down to a mix of luck and effort. Another
36%
credit mostly their own effort; just 7% say it was mostly luck.
That mindset shows up in how people rate their luck. Those who credit mostly
their own effort
give themselves a
4.6 out of 10, vs.
5.8
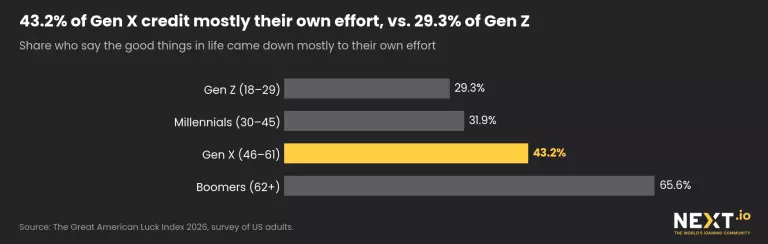
for those who split the credit. Gen X is far more “self-made” than Gen Z:
43%
credit mostly their own effort, vs.
29%.
Same Superstitions, Different Zip Codes
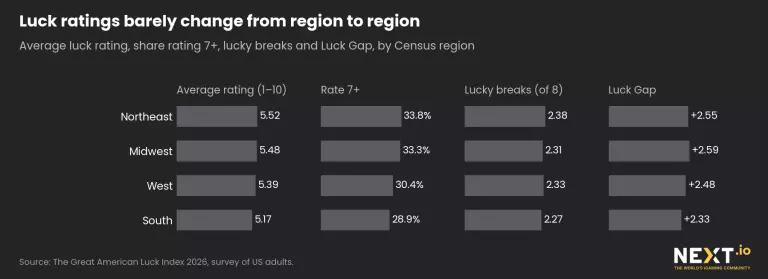
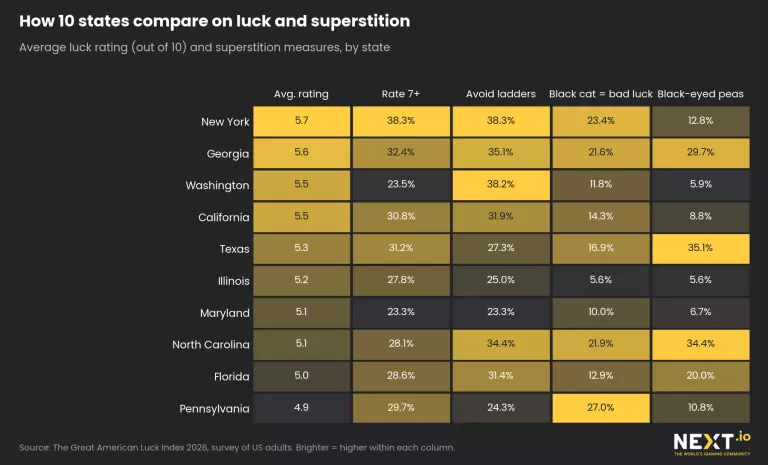
No region gets to call itself America’s luckiest: average luck ratings run from 5.2 in the South to 5.5 in the Northeast. What changes from coast to coast is the habits.
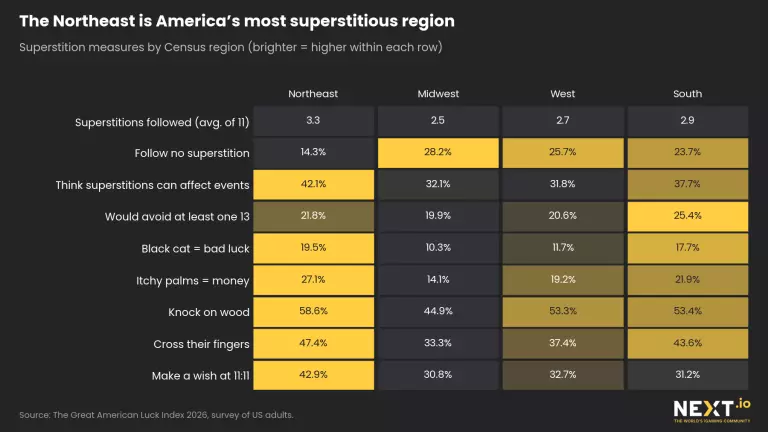
Northeasterners follow 3.3 superstitions per person; Midwesterners, 2.5.
Northeast:
The most superstitious corner of the country. Only 14% follow no superstitions at all, vs. 28% in the Midwest. More than
1 in 4
(27%) link an
itchy palm to money, 20% see a black cat as bad luck, and 12% eat pork and sauerkraut on New Year’s, vs. less than 1% in the West.
Midwest:
The least superstitious region:
28%
follow no superstitions at all. The
midnight kiss
still reaches
35%
on New Year’s Eve.
South:
Black-eyed peas and greens country, where
59%
follow at least one New Year’s luck tradition. The caution extends to the front door, too:
10%
would avoid a house number with a 13 in it, vs. 3% in the Northeast.
West:
More than half (52%) skip New Year’s luck rituals entirely, the highest share of any region.
“In the Northeast, only 14% follow no superstitions at all. In the Midwest, it’s twice as many.”
Knock on Wood: America’s Favorite Superstitions
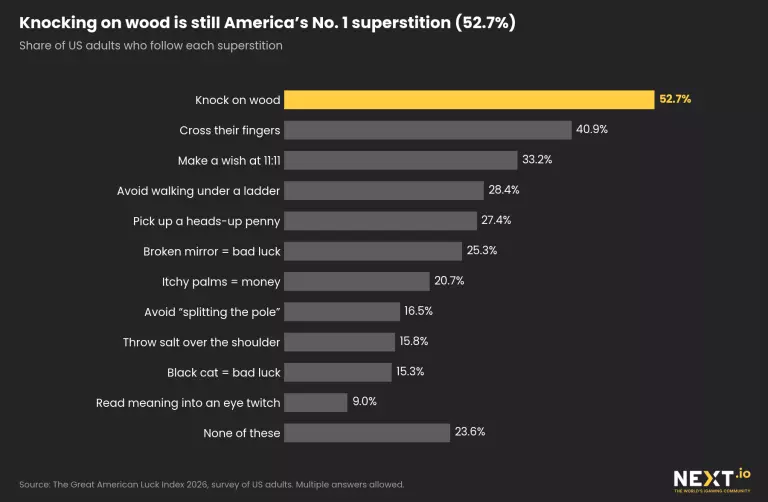
Three in four Americans (76%) follow at least one superstition, 2.9 on average.
Knocking on wood
is still the No. 1 habit (53%), and
28%
still won’t walk under a ladder. More than
a third
(36%) believe these little rituals can actually
change what happens
to them.
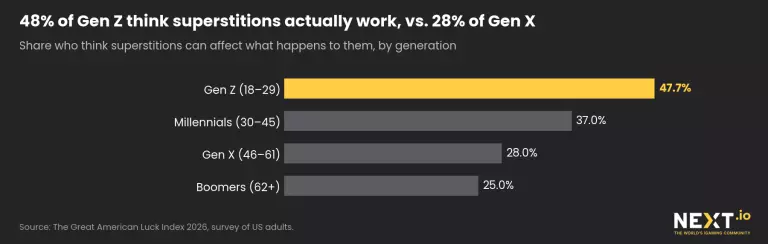
Gen Z
isn’t more superstitious than older generations, but it’s more of a believer:
48%think superstitions work,
vs. 28% of Gen X. The playbook is different, too. Gen Z leads on
11:11 wishes
(40%) and reading meaning into an
eye twitch
(13%), while Gen X is more likely to
pick up a heads-up penny
(35%) and to think an
itchy palmmeans money is coming
(26% vs. 13% of Gen Z). The rituals change; the urge to make sense of chance doesn’t.
“48% of Gen Z believe superstitions work. Among Gen X, it’s 28%.”
Ghosts Have More Believers Than You’d Think
Just in time for Halloween:
65%
of Americans believe in at least one of the following:
ghosts, haunted places, curses, or psychics. And 42% believe in both ghosts and haunted places.
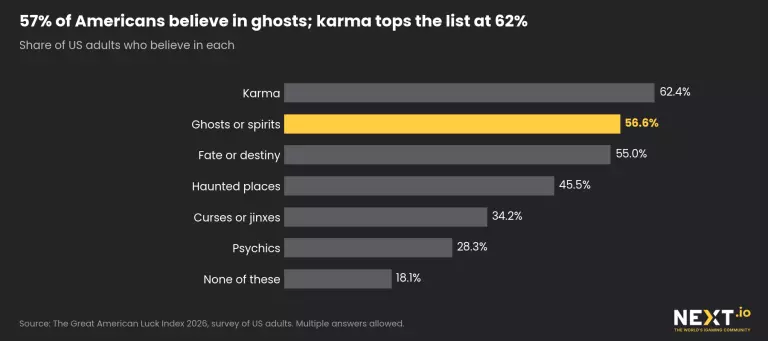
Ghosts (57%) have as many believers as fate (55%), and karma tops them both at 62%.
Curses divide men and women more than they divide generations: 40% of women believe in them, vs. 25% of men.
“57% of Americans believe in ghosts. 55% believe in fate. Karma beats them both: 62%.”
The Black Cat Just Wants to Cross the Street
Black cats have a bad reputation but few real detractors: just
15%
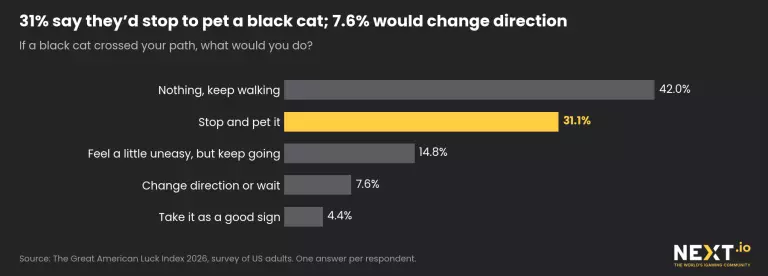
of Americans see one as bad luck. Asked what they’d do if a black cat crossed their path,
42%
say they’d keep walking, and
31%
say they’d stop to pet it. Only 22% would feel uneasy, change direction or wait, and 4% would take it as a good sign.
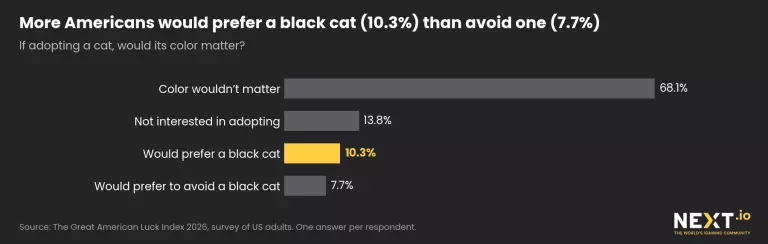
When it comes to adoption,
68%
say a cat’s color wouldn’t matter,
10%
would actually prefer a black cat, and
8%
would rather avoid one. Among those who see black cats as bad luck, though,
1 in 4wouldn’t adopt one.
That’s a stated preference, not a measure of real-world adoptions.
“Only 15% of Americans think black cats bring bad luck. 31% say they’d stop to pet one.”
The More Superstitious Feel Luckier
People who believe superstitions work rate their luck a
5.7, vs. 5.1 for everyone else, and they report more lucky breaks (2.8 vs. 2.0 of the eight).
Among people who pick up heads-up pennies,
45%found atleast $20 in the past five years, vs. 34% of those who don’t. The survey doesn’t prove the penny works. It suggests people who pick it up spend more time looking at the ground.
Friday the 13th: The Number That Splits America
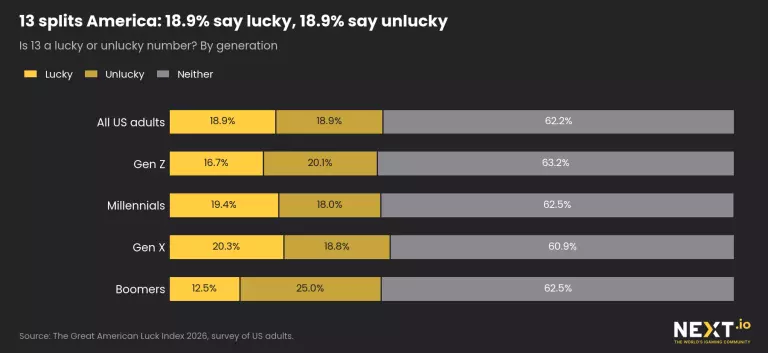
For
19%
of Americans, 13 is a lucky number. For another
19%, it’s unlucky. The remaining 62% say it’s just a number. It’s a perfect tie, at least until check-in:
15%
would turn down or try to avoid a hotel room on the 13th floor, and 13% would avoid Row 13 on a plane. Overall,
23%
would steer clear of at least one of the four 13s we asked about:
a hotel floor,
a plane row,
a home on the 13th floor, or
a house number.
“13 splits America: 19% say it’s lucky, 19% say it’s unlucky. And 15% would turn down a 13th-floor hotel room.”
Just Another Friday (Mostly)
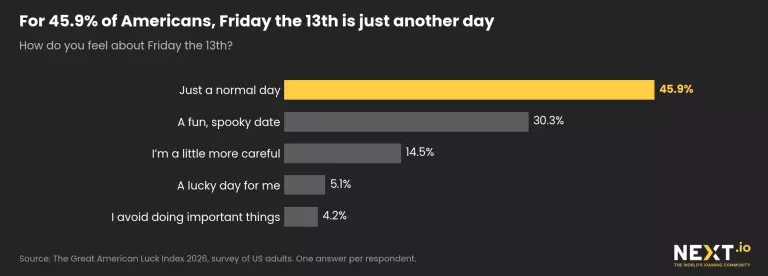
For
46%
of Americans, Friday the 13th is just another day; for
30%, it’s a fun, slightly spooky date.
Gen Z
is the most likely to have fun with it:
36% call it a fun, spooky date, vs. 24% of Gen X.
Friday, Nov. 13, 2026, is the last Friday the 13th of the year. Nearly
11% of Americans plan to do something differently that day, rising to 19% among those who believe superstitions work.
When Friday the 13th Rewrites the Calendar
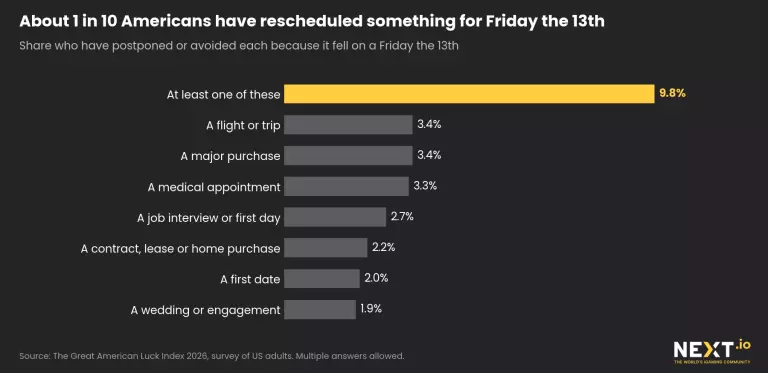
One in 10 Americans(10%) have already postponed or avoided at least one commitment
because it fell on a Friday the 13th. About 1 in 30 have moved a flight, a major purchase, or a medical appointment. For job interviews, it’s about 1 in 37; for contracts, leases and home purchases, about 1 in 45; and for first dates, weddings and engagements, about 1 in 50.
Taylor Swift and the Number 13
Thirteen is Taylor Swift’s well-known lucky number, and 33% of Americans call themselves fans of hers: 6% big fans and 27% casual fans. The data doesn’t show a “Swift effect” on luck. It shows something more interesting: casual fans are much more likely than non-fans to see 13 as meaningful, one way or the other. Among non-fans, 67% call 13 neutral; among casual fans, it’s 50%.
“One in 2 casual Taylor Swift fans sees 13 as lucky or unlucky. Among non-fans, it’s 1 in 3.”
Game-Day Rituals: Superstition Has a Seat on the Couch
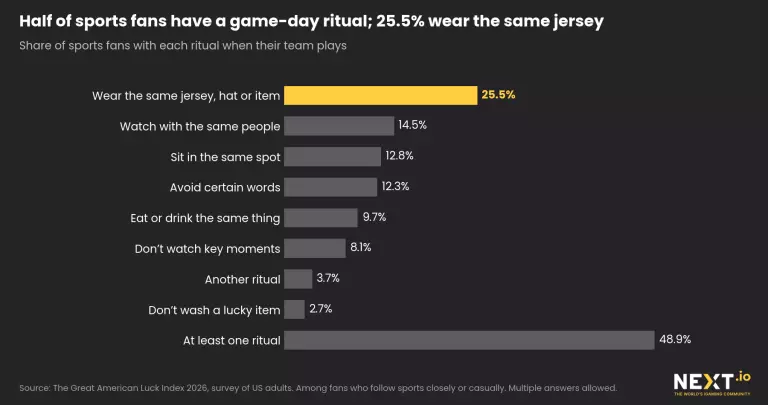
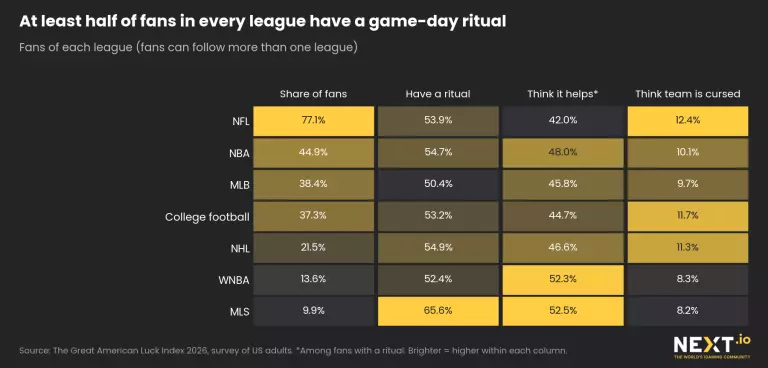
More than two-thirds of Americans (68%) follow sports closely or casually, and half of those fans
have a game-day ritual. Among fans who follow closely, that jumps to
69%.
The most popular ritual is also the most visible:
26% wear the same jersey, hat, or other item. Others always watch with the
same crew (15%)
or
sit in the same spot (13%). Some won’t say certain words, like “no-hitter” during a no-hitter (12%). And 3% won’t wash a lucky item during a winning streak. The laundry can wait.
Does It Work? Doesn’t Matter
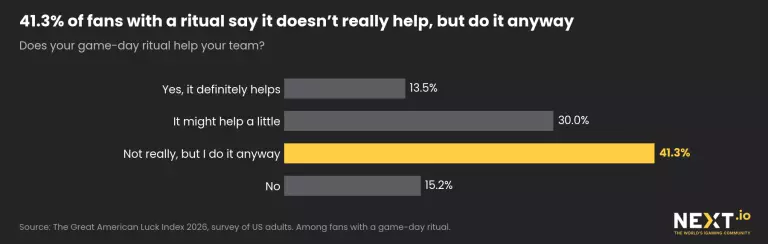
Among fans with a ritual, 14% are convinced it helps and
30% think it might help a little. But 41% admit it doesn’t really do anything and do it anyway.
MLS fans are the most likely to have a ritual (66%), and 20% of MLB fans avoid jinx words during a game, vs. 12% of all fans.
“Half of American sports fans have a game-day ritual. 41% of them admit it doesn’t help and do it anyway.”
The Curse Is Real (to Some Fans)
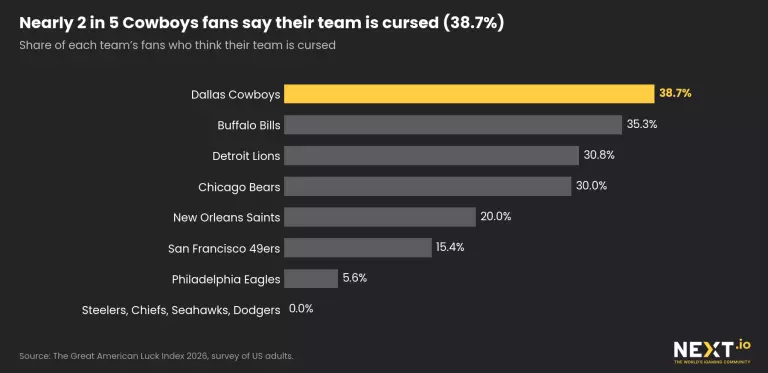
One in 9 fans (11%) believe their team is cursed, rising to 19% among those who follow closely.
Dallas Cowboys fans top the list: nearly
2 in 5 (39%)
say their team is cursed, followed by
Buffalo Bills fans (35%) and Detroit Lions fans (31%). New Orleans Saints fans are less likely to blame a curse (20%), but they’re the most ritual-minded fan base on this list: 73% have a game-day ritual.
Lucky Numbers and Lucky Charms
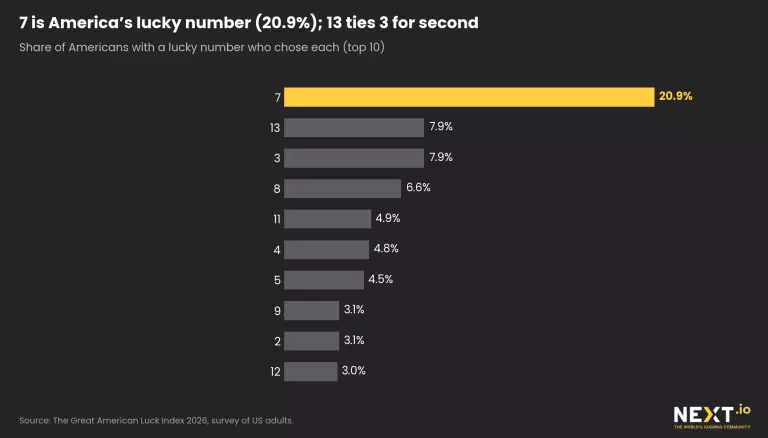
Three in four Americans (75%) have a lucky number, and 7 wins
by a landslide:
21%
of those with a lucky number pick it. Tied for second, with 3, is none other than 13 (8%). Not bad for a number with that reputation.
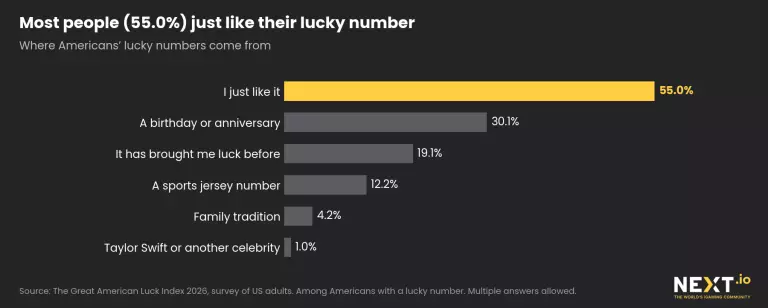
Where do lucky numbers come from? Most people (55%) just like theirs. Others picked a
birthday or anniversary
(30%), a number that
brought them luck before
(19%), or a
sports jersey number
(12%). Only 1% took theirs from Taylor Swift or another celebrity. Seven is the top pick for every generation; 13 makes the top three for Millennials and Gen X, but not for Gen Z or Boomers.
“13 is America’s joint second-favorite lucky number, tied with 3. But 7 is unbeatable: 21%.”
Luck You Can Carry
Half of Americans (50%) have a lucky object, piece of clothing or ritual, most often a lucky object like a
coin, charm, or piece of jewelry
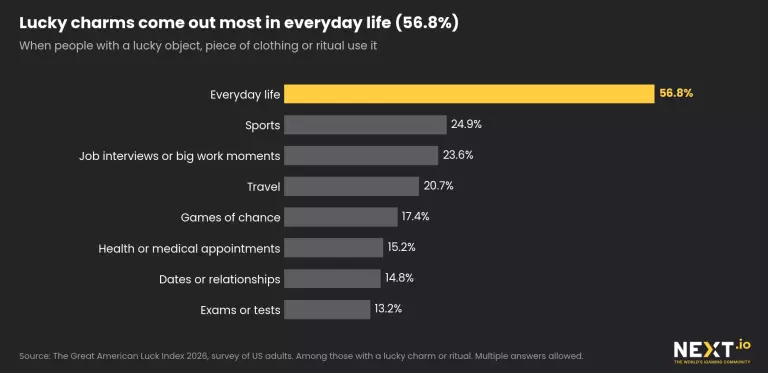
(31%). Most use it in everyday life (57% of charm owners), followed by sports (25%), job interviews and big work moments (24%) and travel (21%).
Thanksgiving: Grateful, With a Wish on the Side
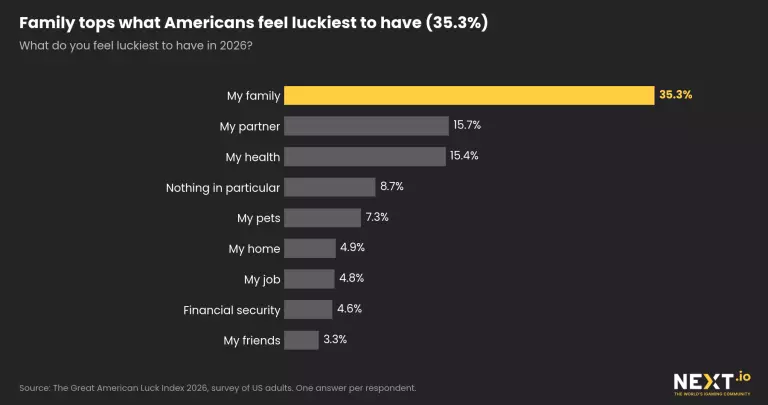
Family is what Americans feel luckiest to have in 2026 (35%), followed by a partner (16%) and their health (15%). Pets (7%) edge out jobs (5%). For some, true luck has four legs. Health matters more with age: 8% of Gen Z name it, vs. 18% of Gen X and 25% of Boomers. Those who feel luckiest to have “nothing in particular” (9%) rate their luck just 4.1 out of 10, vs. 5.4 for everyone else.
“35% of Americans feel luckiest to have their family. 7% their pet, more than their job (5%).”
The Wishbone Is Losing Its Grip
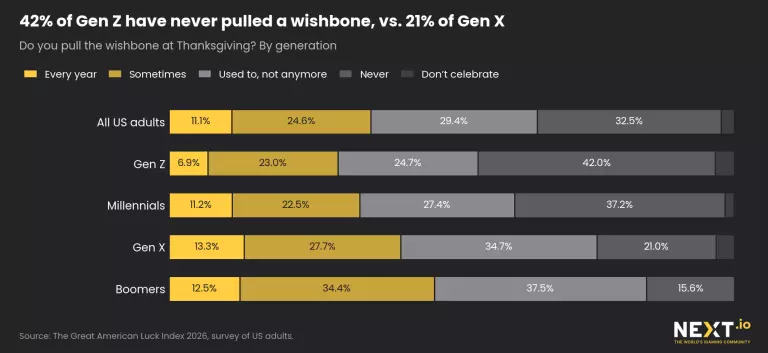
Just over a third of Americans
(36%) still pull the
wishbone
at least sometimes. Another
29%
used to but stopped, 33% have never done it, and 2% don’t celebrate Thanksgiving. The tradition is fading fastest among younger Americans:
42% of Gen Z have never pulled one, vs. 21% of Gen X.
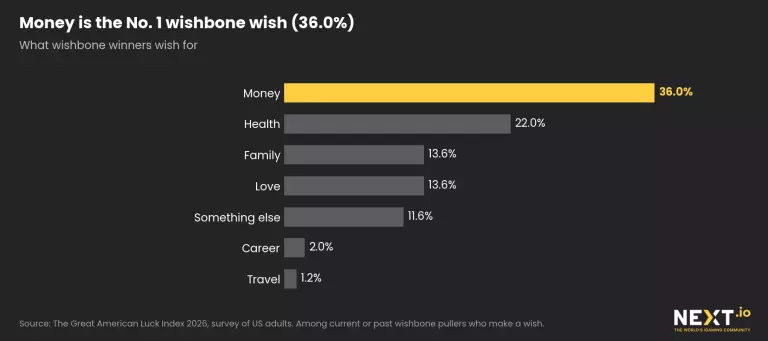
And what do people wish for? Among those who make a wish,
36% ask for money, 22% for health, and 14% each for family and love. Career (2%) and travel (1%) barely register, and 14% of pullers don’t make a wish at all.
Family tops what Americans feel luckiest to have; money tops what they ask the wishbone for. Two different questions, but together they say something very important: being grateful for what you have doesn’t stop you from hoping for a little extra.
“When they win the wishbone, 36% of wish-makers ask for money. Only 14% ask for love.”
New Year’s: A Kiss and Something to Eat
More than
half of Americans(54%)
ring in the new year with at least one luck ritual. The
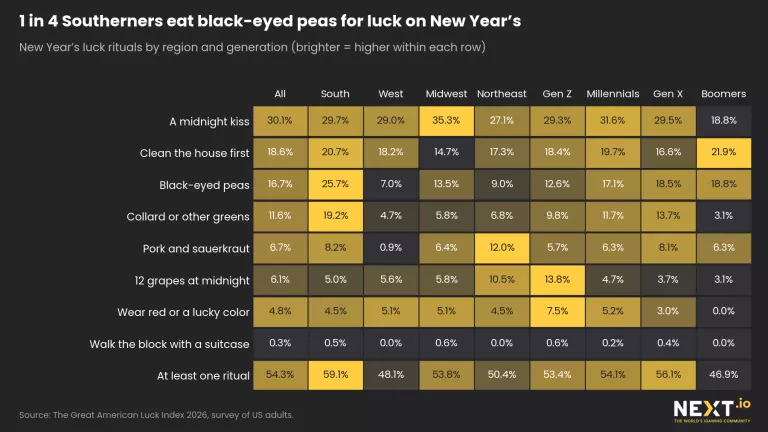
midnight kiss leads (30%), followed by cleaning the house before the new year (19%) and black-eyed peas (17%).
Geography matters. In the
South, 26% eat black-eyed peas, vs. 7% in the
West, and 19% eat collard greens or other greens. In the
Northeast, 12% eat pork and sauerkraut, vs. less than 1% in the West. The
midnight kiss is the No. 1 ritual in every region, from 27% to 35%. Gen Z, meanwhile, is bringing the tradition of eating 12 grapes at midnight: 14% follow it, vs. 3% to 5% of older generations.
“54% of Americans start the new year with a luck ritual. In the South, 26% eat black-eyed peas; in the West, 7%.”
2027: Cautious Optimism
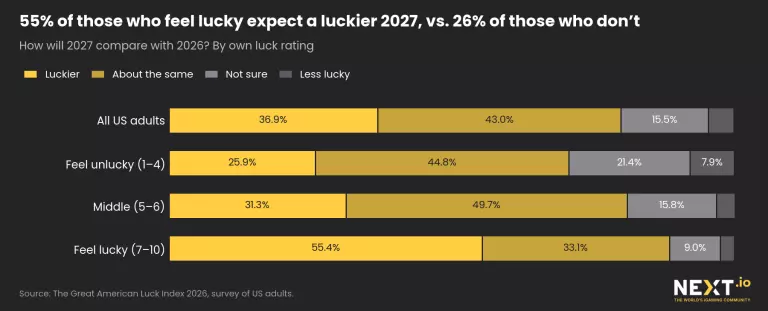
The largest share of Americans (43%) expect 2027 to be about the same as 2026, while
37% expect a luckier year,
15% aren’t sure, and just 5% expect less luck. Already, 42.5% plan to ring in 2027 with a luck tradition, including 48% of Gen Z, 45% of Southerners and 37% of Westerners.
Optimism, like luck, seems to build on itself. Among those who already feel lucky (7 to 10 out of 10), 55% expect a luckier year,
vs. 26% of those who feel unlucky (1 to 4). And people with New Year’s rituals are more optimistic than those without: 45% vs. 27%.
“37% of Americans expect a luckier 2027. Among those who already feel lucky, it’s 55%.”
The Luckiest Zodiac Signs, According to Americans (Not the Stars)
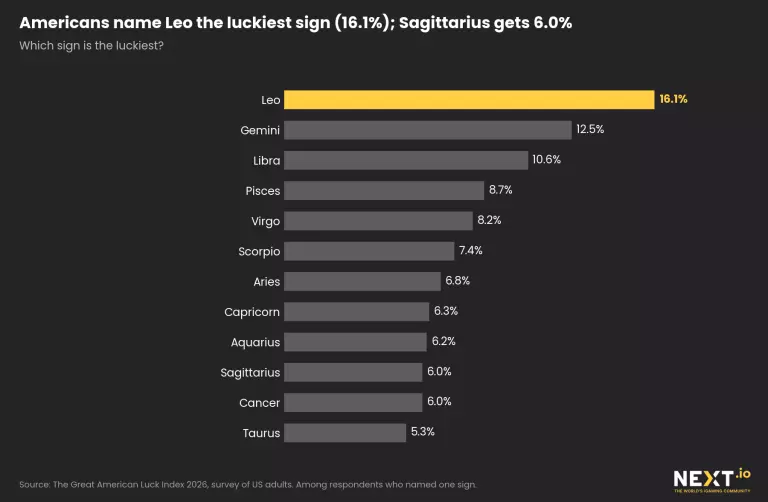
Leohas the best reputation: it’s the sign Americans most often name as the luckiest (16%),
ahead of Gemini (12%) and Libra (11%). But ask each sign to rate its own luck, and the ranking flips.
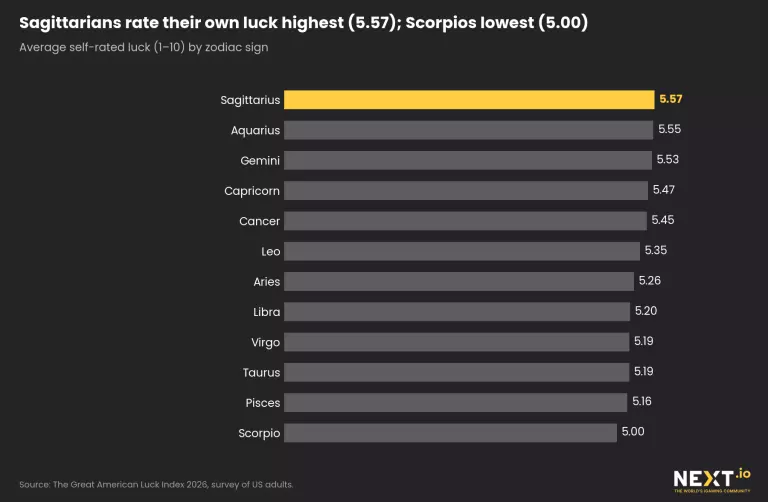
Sagittarians give themselves the highest score
(5.57 out of 10) and
Scorpios the lowest
(5.00). Leos land mid-pack at 5.35, and Sagittarius, No. 1 on self-ratings, gets just 6% of the luckiest-sign votes.
Scorpios may not rate their own luck highly, but they’re loyal to their sign: 33% think Scorpio is the luckiest sign, second only to Leos (35%).
“Americans think Leo is the luckiest sign. But Sagittarians feel luckiest, and Scorpios feel least lucky.”
Horoscope Readers Feel Luckier
Nearly
3 in 4 Americans(73%)rarely or never read their horoscope; 13% read it monthly, 10% weekly and 4% daily. About 1 in 4 (26%) believe their sign affects their luck, rising to 68% among weekly or daily readers.
Readers also feel luckier:
weekly or daily readers rate their luck 5.9, vs. 5.2 for those who rarely or never read horoscopes,
and daily readers reach 6.2. Those who think their sign influences their luck rate it 6.0, vs. 5.1 for everyone else. Correlation, not causation: horoscopes don’t bring luck, but people who read them tend to see more of it.
When Luck Meets the Game
Luck beliefs don’t change the odds. Play responsibly.
This section covers adults 21 and older.
Among Americans who played the
lottery,
sweepstakes casino
games,
sports betting, or similar games in the past 12 months,
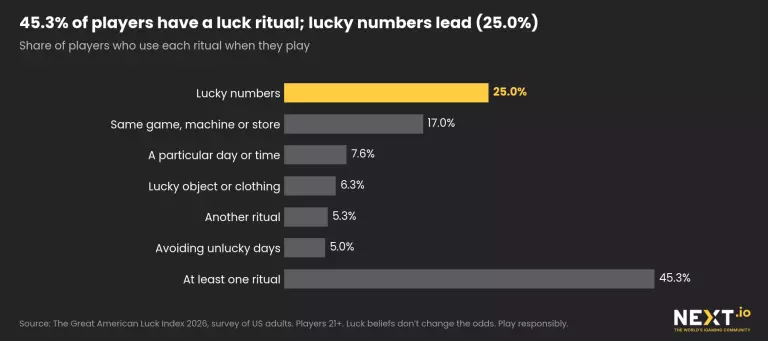
45% have a luck ritual, and 47% of those with a ritual are convinced it improves their chances.
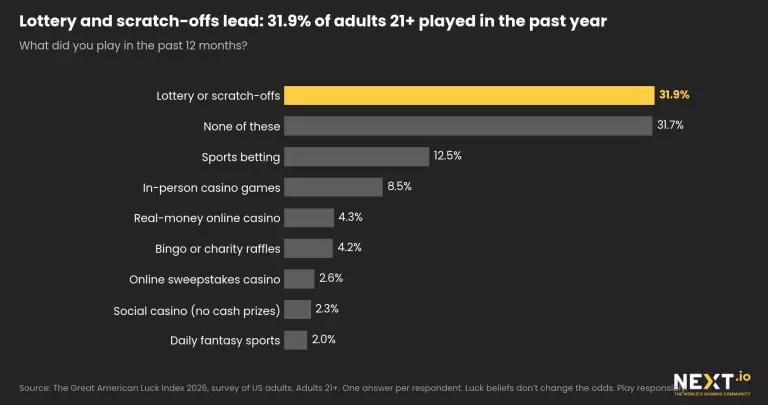
The lottery and scratch-offs are the most popular (32%), followed by sports betting (13%) and in-person casino games (8%). Another 32% didn’t play any of these.
“Nearly half of players with a luck ritual (47%) believe it improves their chances. It doesn’t: luck beliefs don’t change the odds.”
Lucky Numbers Top the List
One in 4 players (25%) uses lucky numbers, and 17% stick with the same game, machine, or store. Among the youngest players, ages 21 to 29, more than half (54%) have a ritual, vs. 45% of all players.
Every Game Has Its Superstition
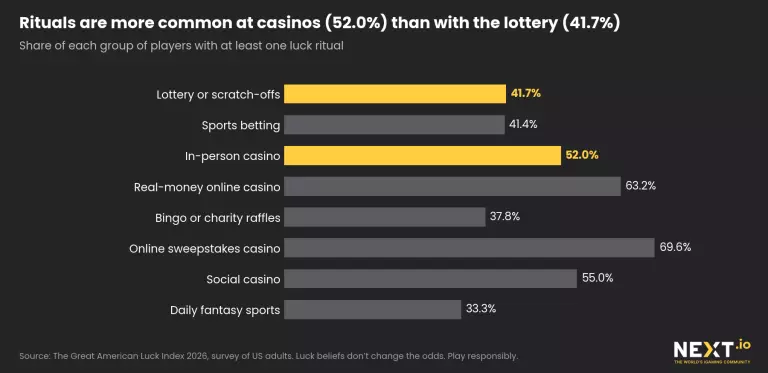
Rituals are more common among in-person
casino players (52%)
than lottery
players (42%), and more common still among
real-money online casino
players (63%)
and
sweepstakes casino players (70%). Sticking with the same game or machine is most common among online casino (45%) and in-person casino players (32%).
Belief in rituals varies, too: 18% of lottery players think rituals help, vs.
43% of sweepstakes casino players, who also give themselves the highest average luck rating of any group (6.04 out of 10, with 57% rating themselves 7 or higher).
Players Vs. Non-Players
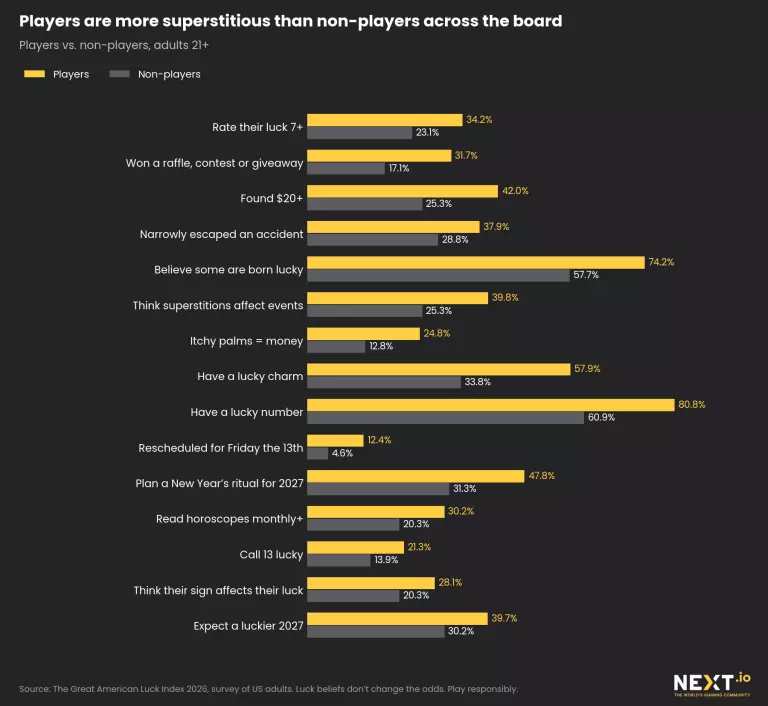
Players rate their luck 5.5 out of 10 on average, vs. 5.0 for non-players. They also report more lucky breaks, follow more superstitions, and are more likely to believe some people are born lucky. That doesn’t mean playing makes anyone luckier: the survey compares people and their answers, not causes or outcomes.
Among sports bettors who follow sports, 64% have a game-day ritual, vs. 46% of other adult fans, and 72% of sports bettors follow sports closely. But fan rituals and playing rituals are different things: only 17% of people with a lucky charm use it for games of chance.
Methodology
The Great American Luck Index 2026 is based on an online survey of 2,000 US adults (18 and older), conducted by NEXT through the Prolific panel on Sept. 29–30, 2026. Responses are self-reported, and results are unweighted.
It has been asked whether, in the past five years, respondents had experienced any of eight events: finding at least $20 or something of equal value; getting a job or a home they had given up on; getting back something important they had lost; meeting a partner or close friend by chance; changing a plan and avoiding a bad situation as a result; narrowly escaping a serious accident; receiving at least $500 they didn’t expect or earn; and winning a raffle, contest, or giveaway. The count reflects how many types of events people experienced, not how many times.
“Perceived luck” is the rating each person gives their own luck, from 1 to 10. “Lived luck” is the number of lucky-break types they reported, converted to a 0–10 scale (events out of eight, multiplied by 10). The Luck Gap is the difference between the two. Because of how the scale is built, a positive gap is not a measure of optimism.
Generations follow stated age: Gen Z 18–29, Millennials 30–45, Gen X 46–61, Boomers 62 and older. Regions are US Census regions, based on the state of residence respondents reported. Zodiac signs are self-reported. Questions about games of chance cover only adults 21 and older and activities in the past 12 months. Follow-up questions, such as the wishbone wish or confidence in a ritual, are reported only among the respondents they apply to.
Percentages are rounded to one decimal place in charts and to whole numbers in the text, so totals may not add up to exactly 100. Multiple-answer questions should not be added together. Regional and zodiac rankings are descriptive. The margin of error for the full sample is about ±3.3 percentage points at 95% confidence; subgroup results have wider margins.
Owning a lucky charm, reading horoscopes, following a ritual, or playing games of chance doesn’t make anyone luckier. The survey shows differences between groups of people, not causes. Luck beliefs don’t change the odds. Play responsibly.
FAQs
On average, Americans rate their own luck 5.3 out of 10, and 31% rate it 7 or higher. Yet 83% had at least one of eight common lucky breaks in the past five years.
Three in four (76%) follow at least one superstition. Knocking on wood is the most common (53%), followed by crossing fingers (41%) and making a wish at 11:11 (33%).
Americans are split: 19% say 13 is lucky, 19% say it’s unlucky, and 62% say neither.
It’s 7, by a wide margin: 21% of Americans with a lucky number choose it. 13 and 3 tie for second (8% each).
Only 15% do. If a black cat crossed their path, 31% say they’d stop to pet it.
Black-eyed peas (17% nationally, 26% in the South), collard or other greens (12%), and pork and sauerkraut (7%).
Americans most often name Leo (16%), but Sagittarians give their own luck the highest rating (5.57 out of 10).